

Call now to get maximum compensation
for your auto accident injuries.


One Of Hawaii's
Top Auto Accident
Attorneys
Over 20 Years of Experience
Millions obtained for our Clients' Car Accident Injuries
No Fees Until We Win Your Auto Accident Case
Lowest Fees Guaranteed
Hawaii Auto Accident Statistics From 15 Years of Injury Records
The Law Offices of David W. Barlow reviewed 292 auto accident injury records in its 2012–2026 inventory. The figures reflect the cases that came through our Hawaii injury practice. Statewide crash statistics are available from the government sources linked below.
This article expands on our five-year Hawaii auto accident statistics review and our review of more than a decade of accident records.
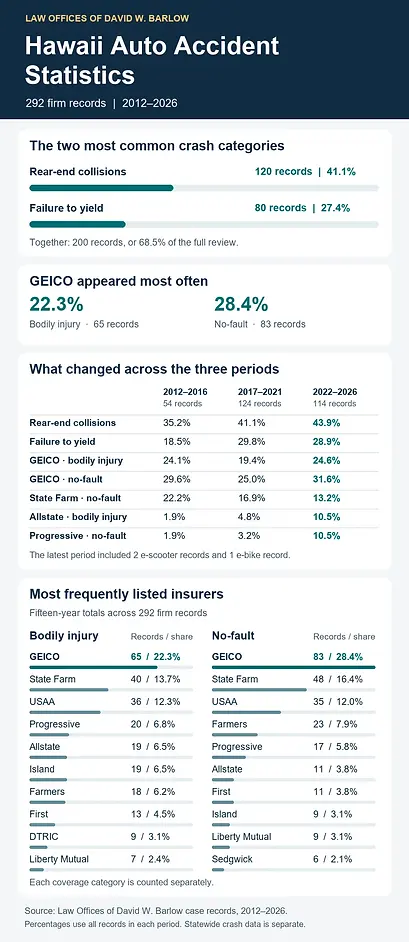
Rear-end collisions were the most common accident category in every five-year period we reviewed. Failure-to-yield accidents made up a substantially larger share of our records after 2016. GEICO was the most frequently listed insurer throughout the review, while Allstate and Progressive gained ground in different parts of the insurance data.
Five, Ten, and Fifteen Years of Hawaii Auto Accident Data
Each line gives the figures in this order 5 years (2022–2026) / 10 years (2017–2026) / 15 years (2012–2026).
-
Records reviewed — 114 / 238 / 292
-
Rear-end collisions — 50 (43.9%) / 101 (42.4%) / 120 (41.1%)
-
Failure to yield — 33 (28.9%) / 70 (29.4%) / 80 (27.4%)
-
Rear-end and failure to yield combined — 83 (72.8%) / 171 (71.8%) / 200 (68.5%)
-
GEICO listed for bodily injury — 28 (24.6%) / 52 (21.8%) / 65 (22.3%)
-
GEICO listed for no-fault insurance — 36 (31.6%) / 67 (28.2%) / 83 (28.4%)
-
Vehicle or road user listed as auto — 79 (69.3%) / 154 (64.7%) / 183 (62.7%)
The periods above overlap. Every record in the five-year group also appears in the ten- and fifteen-year groups. The sections below also compare three separate five-year groups to show when the mix of accidents and insurers changed.
Rear-End Collisions Led in Every Period
We counted 120 rear-end entries, or 41.1% of all records. Their share rose from 35.2% in 2012–2016 to 41.1% in 2017–2021 and 43.9% in 2022–2026. The last two periods had almost the same number of rear-end entries, 51 and 50. The higher recent share reflects the smaller number of total records in that period.
Someone who was stopped in traffic when hit may still face questions about the sequence of impacts, how the collision caused their injuries, and which insurer should receive the bills. Learn about Hawaii rear-end accident claims.
Failure to Yield Showed the Biggest Shift Among the Leading Categories
Failure to yield accounted for 80 records, or 27.4% of the full inventory. Its share rose from 18.5% in 2012–2016 to 29.8% in 2017–2021, then held close to that level at 28.9% in 2022–2026.
Together, rear-end and failure-to-yield entries made up 53.7% of the oldest group, 71.0% of the middle group, and 72.8% of the latest group. Most of the change happened between the first and second periods. The two categories then held at roughly seven in ten records.
Failure-to-yield claims can involve a driver turning left, entering traffic, changing lanes, or crossing a pedestrian’s path. A witness who saw the turn, a photo showing the lane markings, or video capturing the traffic signal may help establish what happened. Learn about Hawaii pedestrian injury claims.
Other Accident Categories in the Fifteen-Year Review
-
General negligence — 26 records (8.9%)
-
Ran a stop sign or traffic light — 25 records (8.6%)
-
Inattention — 19 records (6.5%)
-
Distracted — 5 records (1.7%)
-
Fell asleep — 5 records (1.7%)
-
DUI — 4 records (1.4%)
-
Speeding — 3 records (1.0%)
-
Fall on a bus — 1 record (0.3%)
-
Blown tire — 1 record (0.3%)
-
No accident category recorded — 3 records (1.0%)
The older groups use the label inattention, while the most recent group uses distracted. The workbook gives no common coding rule for those labels, so the figures are shown separately. A rear-end collision can also involve distraction or speeding, and each row carries only one accident classification.
GEICO Led Both Insurance Categories
GEICO appeared 65 times in the bodily injury insurance field and 83 times in the no-fault field. State Farm was second overall in both fields, with 40 and 48 entries, respectively. GEICO appeared about 1.6 times as often as State Farm for bodily injury and 1.7 times as often for no-fault insurance.
A single claim can involve different insurers for bodily injury and no-fault coverage. The figures below show how frequently each name appeared in its respective field across the firm’s 292 records.
Most Frequently Listed Bodily Injury Insurers
-
GEICO — 65 records (22.3%)
-
State Farm — 40 records (13.7%)
-
USAA — 36 records (12.3%)
-
Progressive — 20 records (6.8%)
-
Allstate — 19 records (6.5%)
-
Island — 19 records (6.5%)
-
Farmers — 18 records (6.2%)
-
First — 13 records (4.5%)
-
DTRIC — 9 records (3.1%)
-
Liberty Mutual — 7 records (2.4%)
Most Frequently Listed No-Fault Insurers
-
GEICO — 83 records (28.4%)
-
State Farm — 48 records (16.4%)
-
USAA — 35 records (12.0%)
-
Farmers — 23 records (7.9%)
-
Progressive — 17 records (5.8%)
-
Allstate — 11 records (3.8%)
-
First — 11 records (3.8%)
-
Island — 9 records (3.1%)
-
Liberty Mutual — 9 records (3.1%)
-
Sedgwick — 6 records (2.1%)
Which Insurers Became More Prominent?
GEICO stayed in first place, with a dip in the middle period. Its bodily injury share went from 24.1% to 19.4% to 24.6% across the three separate five-year groups. Its no-fault share went from 29.6% to 25.0% to 31.6%. GEICO was more prominent in the latest group than in the middle one, while its recent bodily injury share was close to where it started.
Allstate rose steadily in the bodily injury field. Its share went from 1.9% in 2012–2016 to 4.8% in 2017–2021 and 10.5% in 2022–2026. It appeared 12 times in the latest period, placing third behind GEICO and State Farm.
Progressive gained ground in the no-fault field. Its share rose from 1.9% to 3.2% to 10.5%. It ranked third in the most recent group, with 12 entries. State Farm’s no-fault share declined from 22.2% in the oldest group to 16.9% in the middle and 13.2% in the latest. State Farm still ranked second in all three groups.
If you are unsure which insurer should receive your medical bills or handle your injury claim, our Hawaii car accident lawyer page explains how our office helps with auto insurance claims.
How the Mix of Vehicles and Road Users Changed
Each line gives the counts for 2012–2016 / 2017–2021 / 2022–2026, followed by the fifteen-year total and share.
-
Auto — 29 / 75 / 79. Fifteen-year total of 183 records (62.7%).
-
Bicycle — 6 / 15 / 10. Fifteen-year total of 31 records (10.6%).
-
Pedestrian — 9 / 10 / 8. Fifteen-year total of 27 records (9.2%).
-
Moped — 4 / 12 / 8. Fifteen-year total of 24 records (8.2%).
-
Motorcycle — 6 / 9 / 6. Fifteen-year total of 21 records (7.2%).
-
Bus — 0 / 3 / 0. Fifteen-year total of 3 records (1.0%).
-
E-scooter — 0 / 0 / 2. Fifteen-year total of 2 records (0.7%).
-
E-bike — 0 / 0 / 1. Fifteen-year total of 1 record (0.3%).
The share coded as auto increased in each period, from 53.7% to 60.5% to 69.3%. Pedestrian entries stayed between eight and ten per period, while their share fell from 16.7% in the oldest group to 7.0% in the latest. The larger number of overall records in the recent group explains much of that change in share.
E-bikes and e-scooters first appeared in the latest group, with three records combined. They joined a case mix that has long included bicycle, moped, motorcycle, and pedestrian injuries. Learn about Hawaii e-bike and e-scooter accident claims.
How We Counted the Records
We counted one entry per populated case row. The totals include possible repeat entries, so they describe the number of records reviewed. Percentages use all rows in the applicable period, including rows with missing or unspecified categories. The 2026 entries reflect what was in the workbook at the time of review.
For statewide context, the Hawaii Department of Transportation publishes preliminary traffic fatalities by county and road-user type. The State of Hawaii Data Book publishes tables on major crashes, injuries, and deaths. HDOT Safe Communities Program · State of Hawaii Data Book transportation tables
Talk With a Hawaii Auto Accident Lawyer
The Law Offices of David W. Barlow represents people injured in car crashes and other traffic accidents in Honolulu and across Hawaii. Attorney David W. Barlow has a 5.0 out of 5 client review score on Avvo, which also lists his 2014 Top 10 Hawaii Personal Injury Attorney recognition from the National Academy of Personal Injury Attorneys. David W. Barlow’s Avvo profile
If you were injured in a rear-end collision, a failure-to-yield crash, or another Hawaii auto accident, we can review what happened, help identify the insurance involved, and explain your options. Request a free consultation with a Hawaii auto accident lawyer.